A second dynamic compounds the urgency. Fossil fuel combustion often emits sulfur dioxide alongside carbon dioxide, and the resulting sulfate aerosols cool the climate.12 This cooling has offset a substantial share of the warming that accumulated greenhouse gases would otherwise have produced. Historically, air quality regulation has resulted in large sulfate reductions across North America, Europe, and increasingly China. Going forward, the transition away from burning sulfur-containing fossil fuels will further reduce the amount of sulfate aerosol cooling. As a result of the declining sulfate cooling, we will see more of the warming due to the build-up of greenhouse gases in the atmosphere that had been masked.13 Superpollutant mitigation is the main lever available to counteract this unmasked warming because most superpollutant measures reduce warming without removing aerosol cooling alongside.†
While mechanisms exist for companies seeking to act on all five superpollutant groupings, most market-based action to date has concentrated on methane, industrial nitrous oxide, and ozone-depleting substances, where measurement and verification science is most settled and where policy and regulation have yet to fully cover those emissions. Market-based actions for credible F-gas abatement are rapidly emerging, while agricultural nitrous oxide abatement pathways are at an earlier stage of development, and benefit from oftentimes addressing methane and black carbon at the same time. Black carbon and tropospheric ozone precursor gases (such as carbon monoxide and volatile organic compounds) are being addressed more selectively by both markets and policy, as later chapters detail.
† Black carbon is the main exception: measures targeting it typically also reduce co-emitted organic carbon and sulfate, which cool, so the net forcing reduction is often smaller than the black carbon figure alone implies. Agricultural nitrous oxide measures may similarly reduce ammonia and associated nitrate aerosol, though this effect is small relative to sulfate.
Table 1: Global warming potentials of common superpollutants
| GHG or Class of GHG | Radiative Forcing (W/m2) | Types/Examples | GWP-20 | GWP-100 |
|---|---|---|---|---|
| Carbon Dioxide (CO2) | 2.3330 | 1 | 1 | |
| Methane (CH4) | 0.5670 | Fossil | 82.5 | 29.8 |
| Non-fossil | 79.7 | 27.0 | ||
| Nitrous Oxide (N2O) | 0.2260 | 273 | 273 | |
| Chlorofluorocarbons (CFCs) | 0.2980 | CFC-12 | 12700 | 12500 |
| Hydrochlorofluorocarbons (HCFCs) | 0.0600 | HCFC-22 | 5690 | 1960 |
| HCFC-141b | 2710 | 860 | ||
| HCFC-142b | 5510 | 2300 | ||
| Hydrofluorocarbons (HFCs) | 0.0480 | HFC-32 | 2690 | 771 |
| HFC-134a | 4140 | 1530 | ||
| Hydrofluoroolefins (HFOs) | Negligible | HFO-1234yf | 1.81 | 0.50 |
| Perfluorocarbons (PFCs) | In AR6 halog. total* | PFC-14 | 5300 | 7380 |
| PFC-116 | 8940 | 12400 | ||
| Sulfur Hexafluoride (SF6) | ~0.007 | 18200 | 24300 | |
| Nitrogen Trifluoride (NF3) | Negligible | 13400 | 17400 | |
| Black Carbon (BC) | 0.3000 | n/a | n/a | |
| Tropospheric Ozone (TO) | 0.4000 | n/a | n/a |
* PFCs fall within the IPCC AR6 aggregate for all halogenated gases (0.41 W/m2, 1750-2019); the PFC share is small.
Methane
Following carbon dioxide, methane (CH4) is the second-largest contributor to anthropogenic climate change, responsible for approximately 30 percent of gross warming since pre-industrial times.15 Front-loaded potency is its most important characteristic: over 20 years, one ton of methane traps as much heat as approximately 80 tons of carbon dioxide (GWP-20) while it is 28 tons when integrated over a century (GWP-100) as the gas naturally breaks down.16 That short-lived but intense warming means that reductions today produce discernible temperature benefits within decades. Methane is also a key precursor gas of tropospheric ozone, which is itself a superpollutant with significant negative effects on human health, agricultural yields, and ecosystems.17 Therefore, reductions in methane emissions have the added benefit of reducing ozone-related harms.18
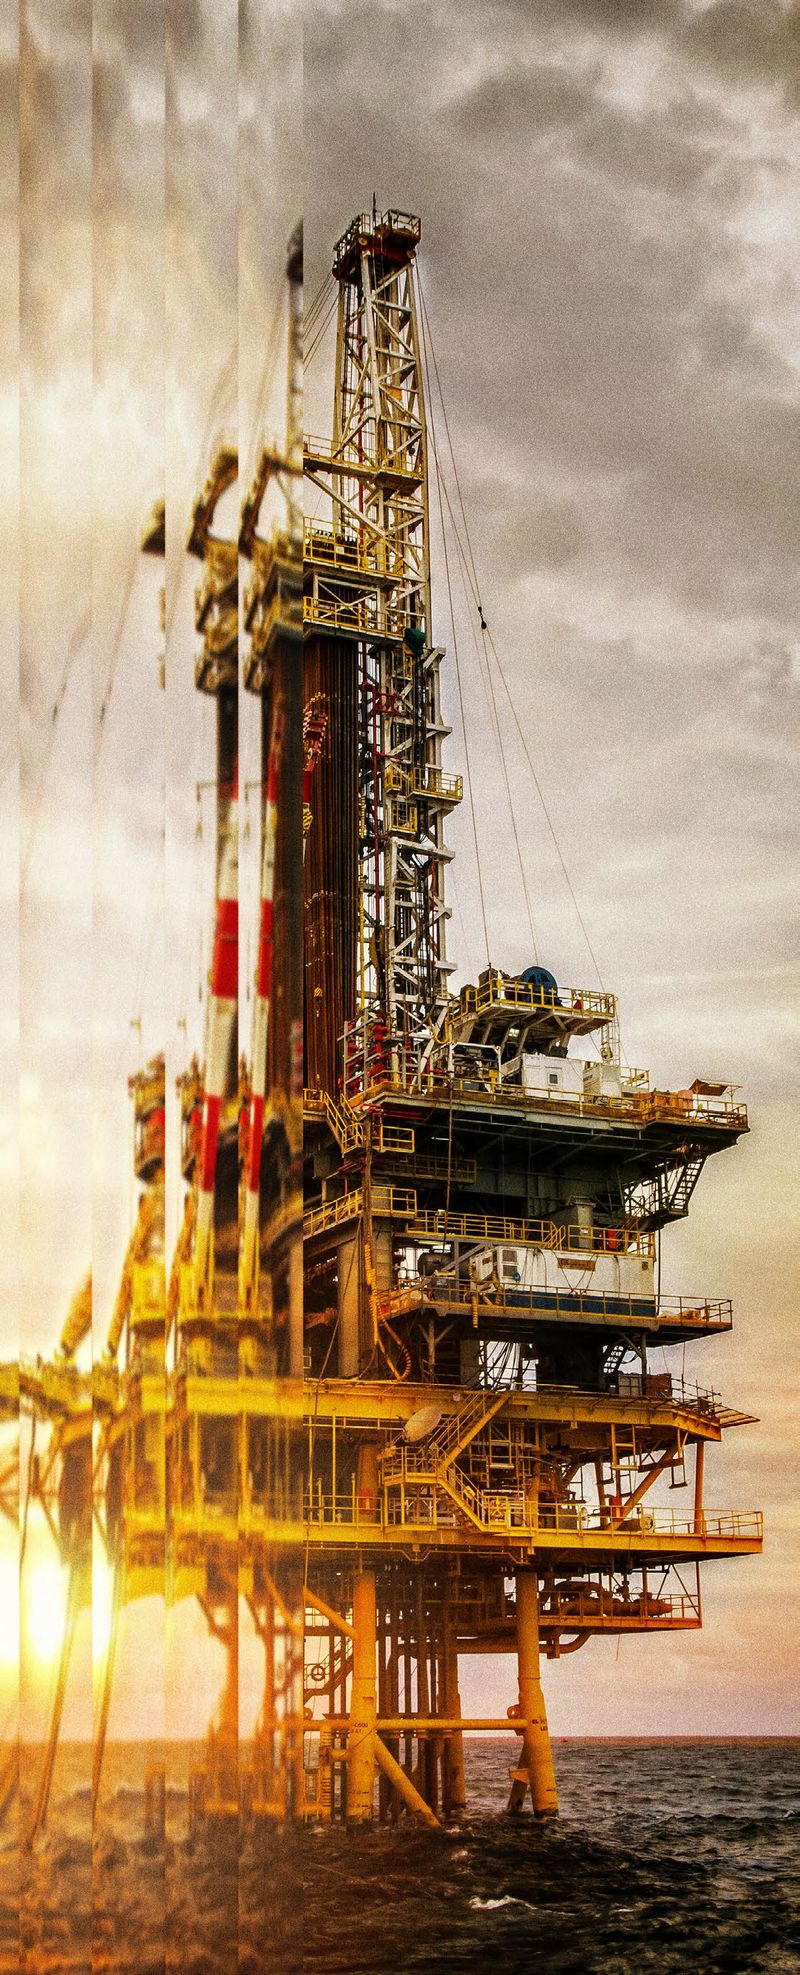
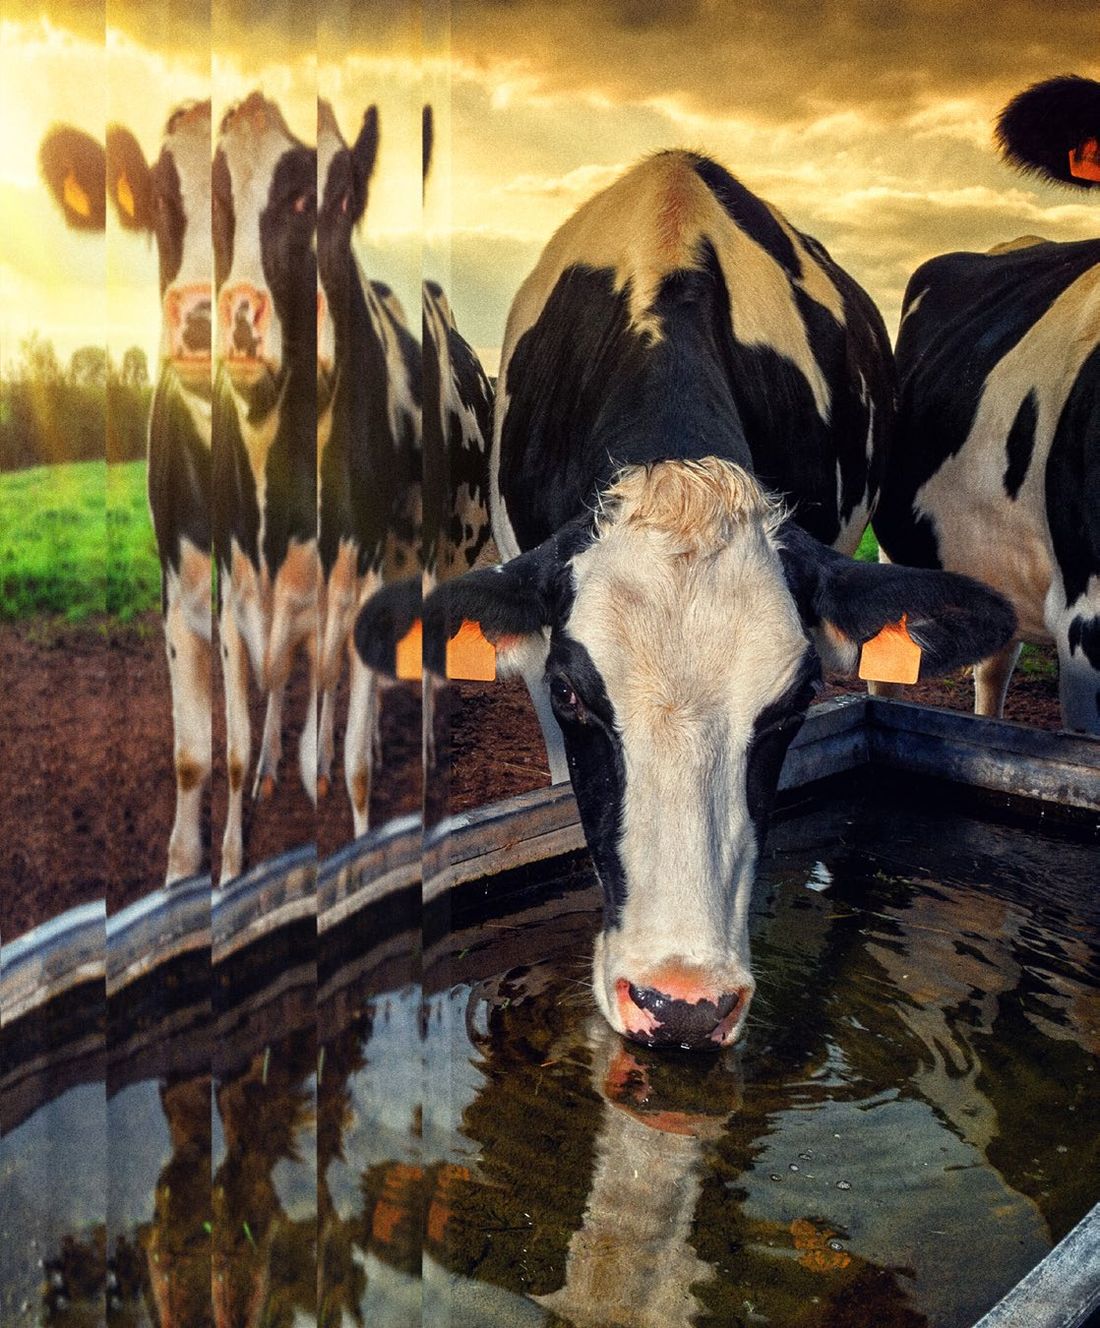
More than 60 percent of annual methane emissions today come from human (anthropogenic) activities, with roughly 95 percent of those concentrated in three sectors.19 Agriculture is the largest source of anthropogenic methane, at approximately 40 percent, generated largely by livestock, manure, and rice cultivation.20 Fossil fuel operations (extraction, processing, and transport) contribute about 35 percent through fugitive leaks, venting, and flaring.21 Waste systems, primarily landfills and wastewater treatment, add around 20 percent through organic matter decomposition in oxygen-limited environments.22 A smaller but still meaningful share of total emissions comes from land use and land management practices, such as creating reservoirs, draining peatlands, and altering wildfire patterns.23
The remaining roughly 40 percent of total global methane flux comes from natural sources, principally wetlands, permafrost thaw, and freshwater systems. In fact, wetland emissions are themselves sensitive to warming, meaning that continued climate change could increase natural methane output further, compounding the anthropogenic signal rather than remaining a fixed background contribution.24 These natural sources are typically among the most difficult emission flows to quantify and mitigate. Atmospheric methane removal technologies that could address these sources are an emerging field of research.25
Figure 1: Sources of global methane
Proportion of emissions
SOURCE: Carbon Containment Lab analysis of United Nations Environment Programme and Climate and Clean Air Coalition (2021). Global Methane Assessment: Benefits and Costs of Mitigating Methane Emissions. Nairobi: United Nations Environment Programme.
Significant methane reductions are already baked into most climate models yet investments remain minimal.
The IPCC goal of limiting end-of-century peak warming to 2°C (modeled as the Shared Socioeconomic Pathway: Sustainability (SSP1-2.6)), assumes a 46 percent reduction in methane emissions by 2050. The technical means to achieve these goals are largely available and cost-effective today.26 Since most anthropogenic methane emissions are concentrated in specific sectors, mitigation strategies can be highly targeted and actionable. We identified 60 different methane mitigation measures, most of which are already tested, and many of which can rapidly scale up (detailed in Appendix B). Within the fossil fuel industry, for example, standard interventions such as systematic and regular leak detection, the elimination of routine venting and flaring, and the replacement of high-bleed pneumatic equipment can abate emissions at near-zero net cost,27 as the recovered natural gas retains its commercial value.28 In agriculture, dietary additives have demonstrated substantial methane reductions of up to 80 percent in livestock trials, while improved manure management systems capture and treat methane before it escapes into the atmosphere.29 Similarly, the waste sector can prevent emissions through landfill gas capture and utilization or the diversion of organic waste from landfills.30
As methane is an important precursor gas for the formation of tropospheric ozone, mitigating it provides a combined benefit toward both superpollutants and often generates multiple localized benefits for health and safety as well.
Nitrous Oxide
Nitrous oxide (N2O) is responsible for approximately 10 percent of net global warming since the start of the Industrial Revolution. It has an atmospheric lifetime of 109 to 120 years, which makes it longer lived than most other superpollutants.31 Its GWP of 273 holds constant across both 20- and 100-year measurement horizons, a reflection of that stable, persistent warming.32 Nitrous oxide is also an ozone-depleting substance. It reacts in the stratosphere to form nitrogen oxides, which then catalyze the destruction of the ozone layer. To date, nitrous oxide is not controlled under the Montreal Protocol, the treaty framework built specifically to address ozone-depleting substances. This omission leaves its ozone impact effectively unregulated even as its atmospheric concentration continues to rise.33
Nitrous oxide is emitted from both anthropogenic and natural sources. Roughly 40 percent of total nitrous oxide emissions are anthropogenic, equivalent to approximately 6 percent of annual global greenhouse gas emissions.34 The largest source of anthropogenic nitrous oxide is agriculture, where direct soil emissions from synthetic fertilizer application, manure management, aquaculture, and biomass burning contribute more than 70 percent of net anthropogenic nitrous oxide emissions.35 Industrial processes and fossil fuels (a combined 16 percent) as well as waste and wastewater treatment (about 5 percent) are the next-largest contributors to net anthropogenic nitrous oxide emissions and are typically point sources.36
Nitrous oxide is also a natural product of the nitrogen cycle—its movement between the atmosphere, plants, animals, soil, and water.37 Most natural nitrous oxide emissions come from bacteria that break down nitrogen in soils and oceans.38
Figure 2: Global nitrous oxide sources
Proportion of emissions
SOURCE: Carbon Containment Lab analysis of United Nations Environment Programme (2024) Global Nitrous Oxide Assessment
The IPCC’s modeled target of limiting end-of-century peak warming to 2°C (SSP1-2.6) assumes a one-third reduction in nitrous oxide emissions by 2050. Industrial and energy sectors hold some of the most immediate, cost-effective abatement opportunities available, particularly in industrial gas production of nitric acid, adipic acid, and caprolactam, where nitrous oxide is an unwanted by-product (as described in Appendix F: Voluntary Carbon Market Case Studies). Installing available pollution control technologies at these facilities could abate 116 million tons of carbon dioxide-equivalent (CO2e) a year by 2030. Two-thirds of this amount is potentially achievable at $0.50 to $5 per ton CO2e.39 This combination of proven technology, low cost, point source, and modest current uptake makes industrial nitrous oxide abatement one of the clearest near-term priorities among the available pathways.
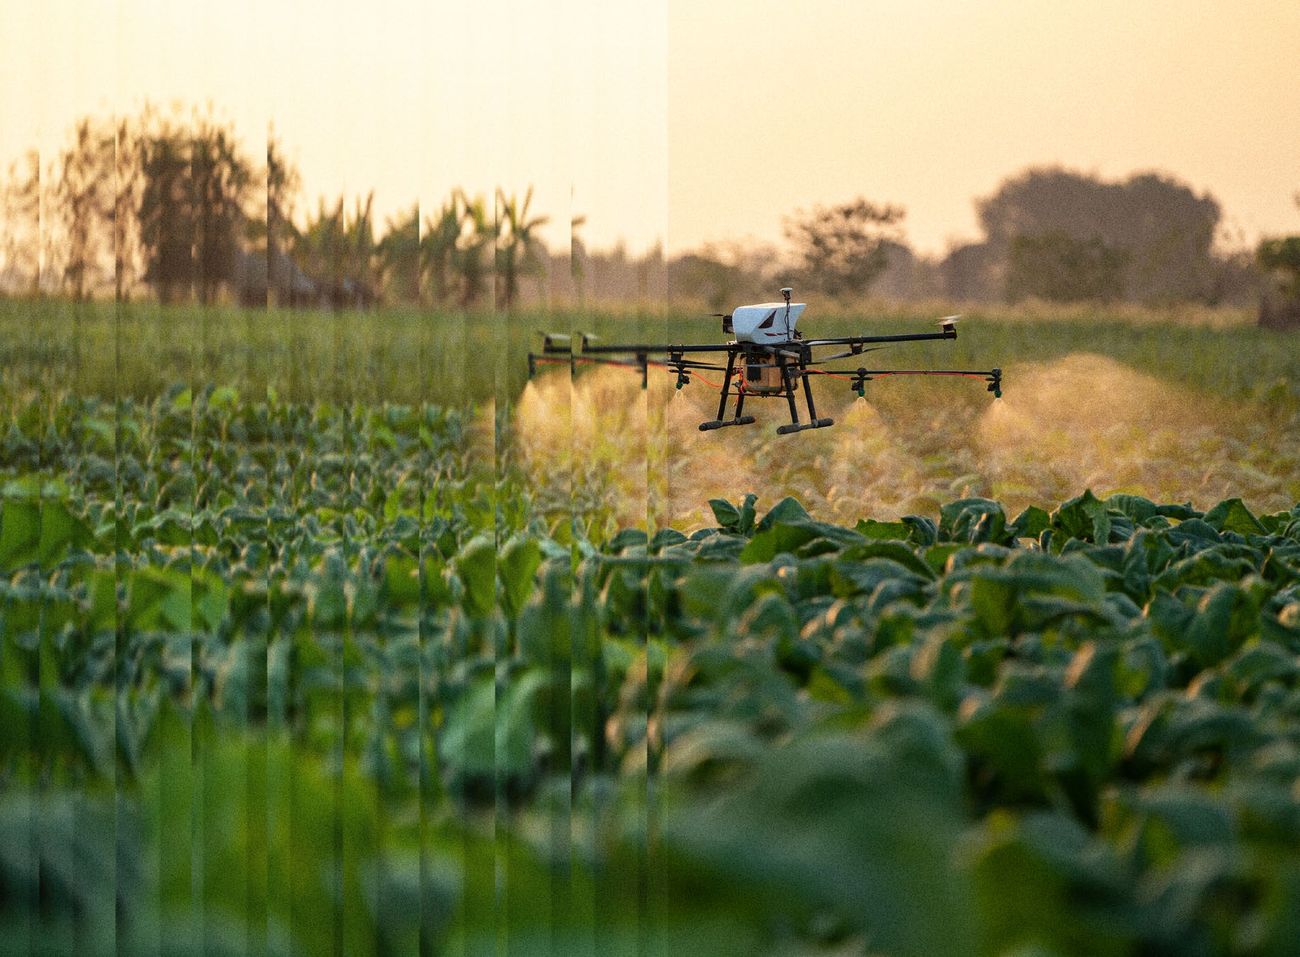
The agricultural sector can also drastically cut nitrous oxide emissions through targeted management. The 4R framework (right source, right rate, right time, right place) pairs reduced nitrogen application rates with enhanced efficiency fertilizers and has been shown to cut total nitrous oxide emissions by more than half without affecting yields.40 These reductions can be achieved at low gross mitigation cost (as fertilizer savings offset a substantial portion of the implementation costs) while generating net savings of roughly $85 per ton of CO2e when including societal benefits.41 Underlying practices are also well-established. However, since nitrous oxide emissions also arise from dispersed, highly variable field conditions, soil type, precipitation, and fertilization patterns, conducting baseline measurement and verification is substantially harder than for industrial point sources.42 Many of the nitrous oxide mitigation measures also contribute to the reduction of tropospheric ozone.
Ozone-Depleting Substances and F-gases
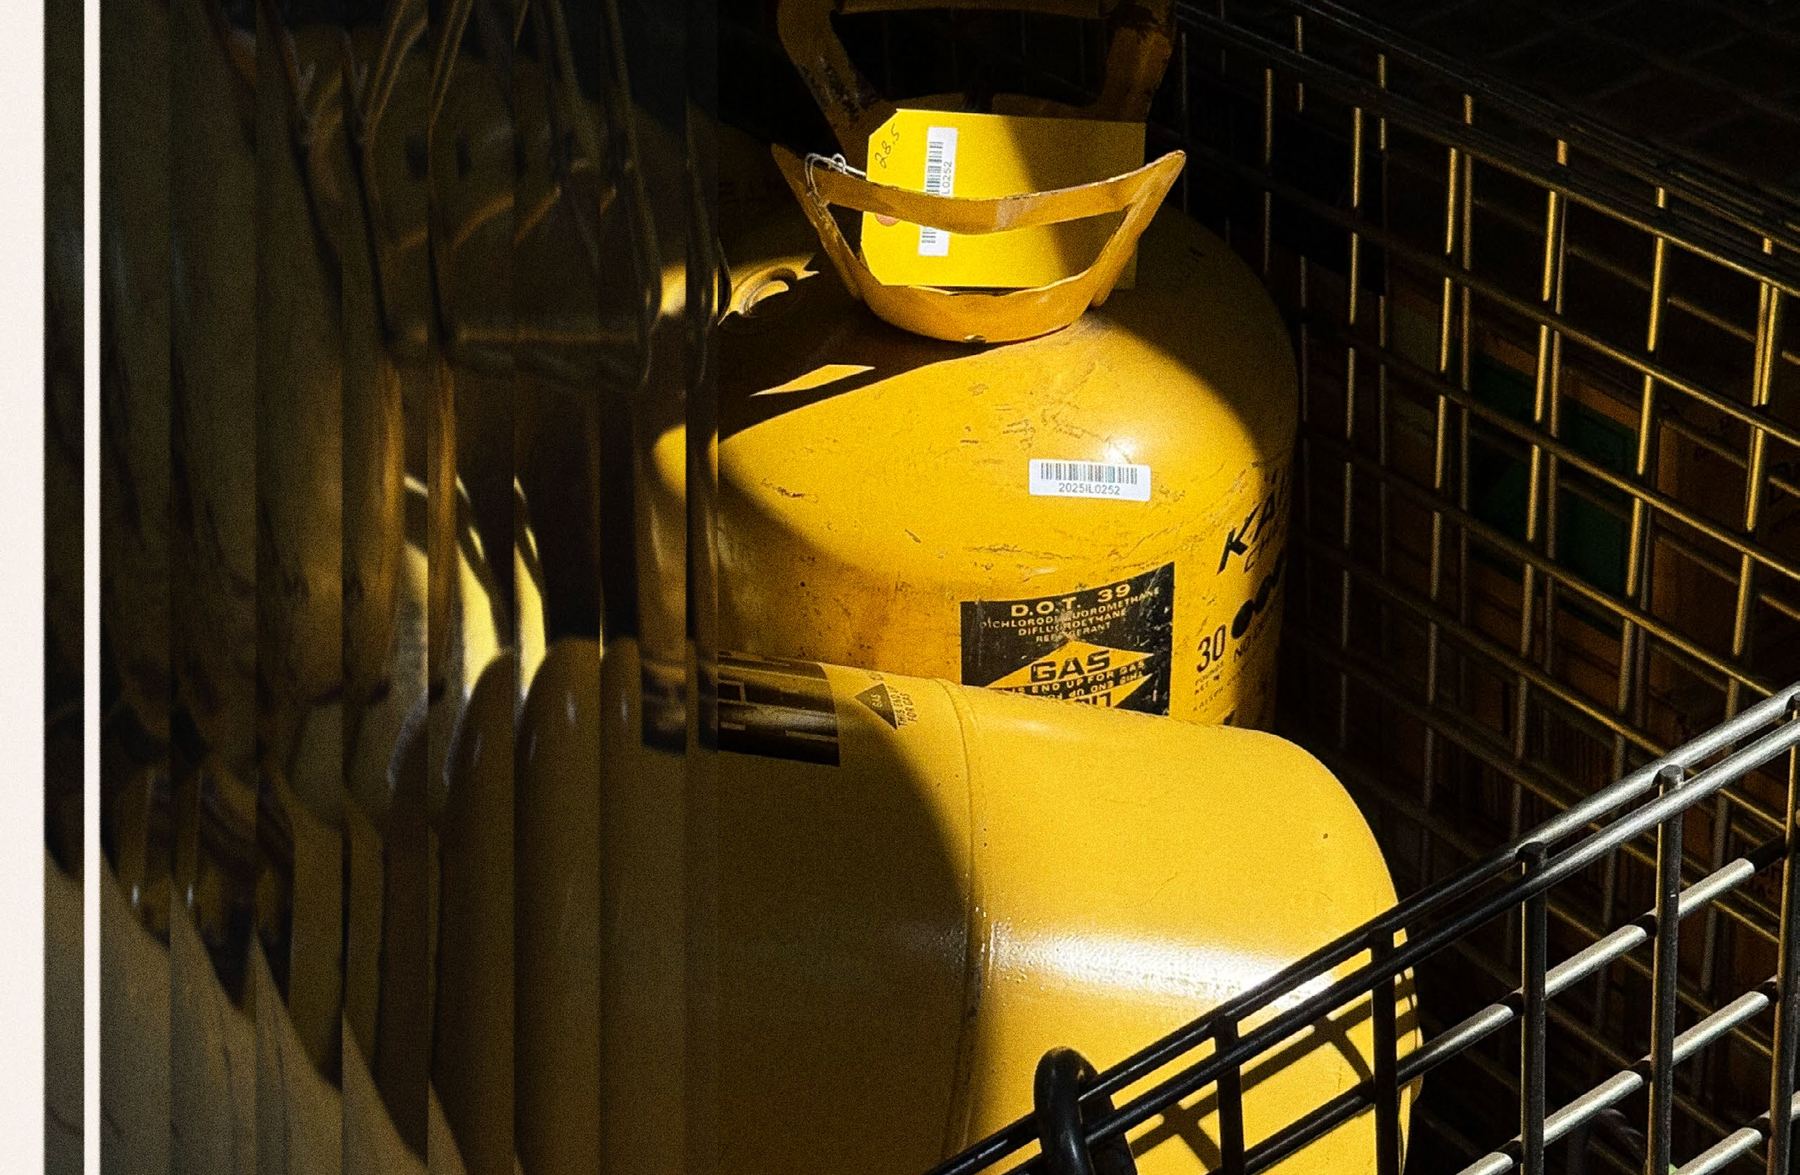
Ozone-depleting substances (ODS) and fluorinated gases (F-gases) are related classes of synthetic, fluorine-containing compounds used primarily in air conditioning, refrigeration, insulation, electronics, and industrial manufacturing as well as the production of commodity materials such as aluminum. Both classes share an extraordinary chemical stability and potent heat-trapping ability, making them industrially valuable but climatically hazardous.43 The rest of this report refers to this group of gases broadly as “F-gases.”
Chlorofluorocarbons (CFCs) and hydrochlorofluorocarbons (HCFCs) were developed during the 20th century for use as refrigerants in air conditioning and refrigeration, aerosol propellants, and blowing agents in foam manufacturing. Due to their chemical stability, they persist in the atmosphere long enough to migrate to the stratosphere, where they catalyze ozone destruction, thinning the ozone layer.44 They are also extraordinarily effective at trapping heat: common CFCs carry a GWP-20 of 8,320 (CFC-11), 12,700 (CFC-12), and 6,860 (CFC-113), respectively.45 CFC production has been fully phased out under the Montreal Protocol. Meanwhile, HCFCs are in the final stages of phaseout, with developed countries targeting full elimination by 2030 and developing countries by 2040.46 Nonetheless, 3.8 million tons of ODS (about 6.8 billion tons of CO2e)47 are estimated to be sitting in old equipment and stockpiles and will reach the atmosphere unless recovered and destroyed.
Hydrofluorocarbons (HFCs) were developed to replace ozone-depleting substances. HFCs do not deplete the ozone layer, but they remain extremely potent greenhouse gases and today represent approximately 90 percent of F-gas by volume and emissions. There are hundreds of different HFCs and HFC blends developed for different applications. Common HFCs are highly potent and have a wide range of atmospheric lifetimes (Appendix A). For example, HFC-32 (prevalent in residential air-conditioning systems) has a GWP-20 of 2,690, HFC-134a (used in automotive air conditioning) has a GWP-20 of 4,140 and HFC-143a (prevalent in commercial refrigeration) has a GWP-20 of 7,840.48 The Kigali Amendment restricts the production of high GWP HFCs. It is expected to limit projected HFC-induced warming in 2100 by around 90 percent compared to a no HFC policy case.49 However, as with ODS, the bank of HFC emissions sitting in equipment and stockpiles continues to grow rapidly and will eventually be released into the atmosphere absent intervention. Other macro factors related to growing demand and economic development are expected to cause the cooling sector to account for more than 10 percent of total global emissions in 2050.50
ODS and F-gases share an extraordinary chemical stability and potent heat-trapping ability, making them industrially valuable but climatically hazardous.
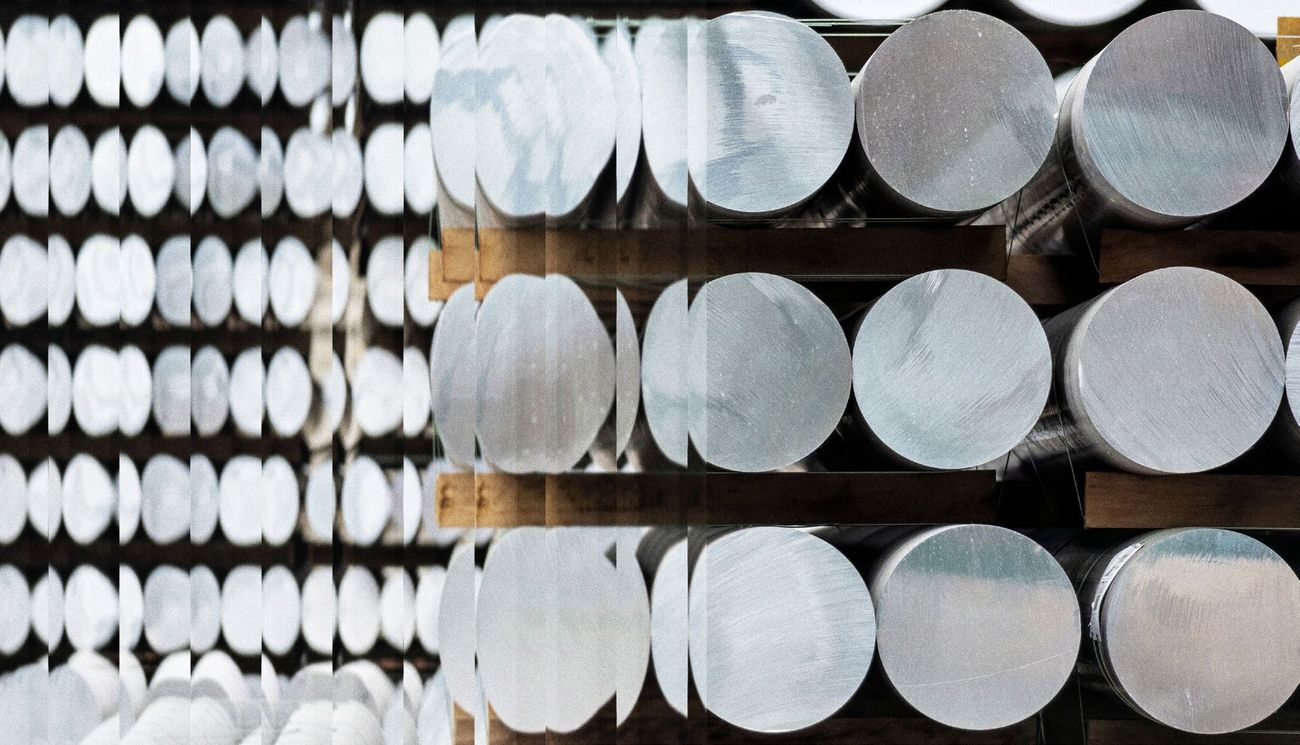
Hydrofluoroolefins (HFOs) represent a newly developed subclass of HFCs that break down in the atmosphere within days, resulting in ultra-low GWP.51 For example, the widely adopted HFO-1234yf (used in automotive air conditioning) carries a GWP-20 of 1.81, and HFO-1234ze(E) (used as a foam blowing agent and aerosol propellant) has a GWP-20 of 4.94.52 HFOs do not deplete the ozone layer, though they typically exhibit mild flammability, requiring safety features in system design.53 Also, HFOs belong to the broader class of per- and polyfluoroalkyl substances (PFAS), and their atmospheric degradation produces trifluoroacetic acid (TFA), a persistent environmental contaminant that accumulates in water systems and soils.54 The growing evidence of its impact on the environment and human health has prompted scientific and regulatory scrutiny, including restrictions under the emerging European Union’s PFAS rules.55
Perfluorocarbons (PFCs) are fully fluorinated compounds with extraordinary atmospheric longevity, making their cumulative warming impact disproportionate to their emission volume.56 The main sources are from primary aluminum and semiconductors production.57 PFCs carry high 20-year and 100-year GWPs. For example, CF4 (PFC-14) has a GWP-20 of 5,300 and a GWP-100 of 7,380. Abatement efforts in the aluminum industry have sharply reduced PFC emission intensity since the 1990s. However, total global PFC emissions have continued to grow in recent years, primarily due to rising aluminum production in China.58
Sulfur hexafluoride (SF6) is the most potent greenhouse gas currently known, carrying a GWP-20 of 18,200, a GWP-100 of 24,300,59 and an atmospheric lifetime of up to 3,200 years.60 It is used primarily as an electrical insulator in high-voltage switchgear and transmission equipment as well as in magnesium foundries and semiconductor manufacturing. Gases can escape through aging seals, small pipeline leaks, routine maintenance, refilling processes, or catastrophic equipment failure.61 Global SF6 use has been rising as power grids expand to support both economic growth and renewable energy deployment, particularly in emerging economies, where new wind and solar installations require substantial new high-voltage switchgear.62 SF6 represents a small share of total F-gas emissions by volume, but its extreme potency means that mitigation efforts such as promoting substitutes or stopping leaks should be a priority.
Lifecycle refrigerant management is estimated to potentially avoid an additional 39 billion tons of CO2e from 2025 to 2050.
Nitrogen trifluoride (NF3) is another highly potent gas which is used in the semiconductor industry as a plasma etchant and chamber cleaning agent, with a GWP-20 of 13,400 and a GWP-100 of 17,400.63 Its atmospheric lifetime is approximately 569 years and it has been mandated for inclusion in national greenhouse gas inventories under the UNFCCC since 2013.64 NF3 represents the smallest of the F-gas classes by total emissions volume, but its use has grown alongside the expansion of global semiconductor manufacturing capacity.65
Unlike methane and nitrous oxide, ozone-depleting substances and F-gases are entirely synthetic, meaning every molecule in the atmosphere originates from human production rather than natural background sources. This quality gives policymakers and companies a more direct lever over both ends of the life cycle. In other words, production can be capped or banned outright, controls implemented to stop leaks and fugitive emissions, and existing banks can be actively recovered and recycled or destroyed. Reflecting this greater degree of control, SSP1-2.6, the IPCC scenario consistent with limiting end-of-century warming to below 2°C, assumes a more than 87 percent reduction in F-gas emissions by 2050.
The main mitigation measures for ODS and F-gases fall into three interconnected areas: reducing cooling demand, transitioning to low- or zero-GWP gases and equipment, and managing the gases across their full life cycle.66 All of these complement the production phase downs in place under international policy. Passive measures, such as better insulation and shading, optimized temperature settings, and better system controls, can reduce the amount of cooling and therefore volume of gases required in the first place. Transitioning technologies from high-GWP refrigerants and equipment to low- and zero-GWP alternatives while maintaining energy efficiency can prevent both direct and indirect energy-related emissions. Lifecycle refrigerant management (LRM) is essential for addressing the large quantity of ODS and F-gases already in equipment and stockpiles. Leak prevention and good servicing practices can reduce emissions during operation.67 Recovery, recycling, and reclamation reduce demand for virgin refrigerant while equipment still has a useful life, and environmentally sound destruction can remove high GWP and ODS gases from circulation to ensure they are never released into the atmosphere. LRM is estimated to potentially avoid an additional 39 billion tons of CO2e from 2025 to 2050 beyond Kigali, making it a major untapped F-gas mitigation opportunity.68
Tropospheric Ozone
Tropospheric or “ground level” ozone is a secondary or “indirect” pollutant—it forms in the lower atmosphere through a series of chemical reactions involving precursor gases: methane (CH4), nitrogen oxides (NOx), non-methane volatile organic compounds (NMVOCs), and carbon monoxide (CO). Molecular hydrogen (H2) also plays a smaller, indirect role through its effects on atmospheric hydroxyl radical (OH) chemistry.69 Tropospheric ozone’s location distinguishes it from stratospheric ozone, the protective layer in the upper atmosphere that absorbs ultraviolet radiation. The two are chemically identical but functionally opposite—that is, protective at altitude, harmful at ground level. Alongside carbon dioxide and methane, tropospheric ozone is among the largest contributors to anthropogenic warming.70
Precursor emissions for tropospheric ozone span the global economy. Nitrogen oxide emissions come from both fossil fuel combustion (coal combustion, vehicle exhaust) and non-fossil sources (biomass burning, microbial nitrogen cycling in soils and animal waste).71 Industrial solvents and chemical manufacturing contribute significantly to NMVOCs, particularly in East Asia and Europe.72 Agricultural burning is a major source of NMVOCs and carbon monoxide across sub-Saharan Africa and Brazil.73 While these non-methane precursors are vital to address, methane holds a distinct role: because its decadal atmospheric lifetime allows it to mix globally before breaking down, it generates a persistent background level of tropospheric ozone worldwide, rather than the regional, short-lived ozone spikes associated with some of the other precursor gases. This global reach is why methane mitigation is highlighted as a standout option for reducing surface ozone levels broadly, complementing the need to address regional precursor emissions.74
Protective at altitude and harmful at ground level, ozone needs careful management to protect both climate and health.
The effects of tropospheric ozone on human populations and ecosystems extend well beyond the climate. By 2030, ozone-induced crop yield losses are projected to be 5 to 26 percent for wheat and 4 to 9 percent for maize under business-as-usual scenarios.75 Further, prolonged tropospheric ozone exposure is associated with approximately 1.4 million deaths a year globally, an all-cause mortality estimate substantially higher than prior figures based on respiratory disease alone.76 Short-term exposure is separately associated with an estimated 177,000 deaths a year.77
Under the 2°C scenario, the IPCC assumes aggressive, globally coordinated air quality policy, supported by stricter pollution control legislation and expanded access to clean cooking fuels, will substantially reduce these precursor emissions. Action on precursor gases can be achieved today; a list of these can be found in Appendix B. Given the regional variation in many of the precursor emissions and their impact, localized analysis of mitigation measures is recommended. Mitigation measures include some that are already on corporate sustainability agendas such as electrifying vehicle fleets and using low-VOC materials and paints. In addition, industrial and power-sector pollution controls are available and already mandated in many countries or states.
Black Carbon
Black carbon, unlike the other pollutants in this roadmap, is not a gas. Commonly known as soot, black carbon is a fine, solid particulate produced by the incomplete combustion of carbon-based fuels, including biomass, coal, and diesel, among other sources.
Black carbon is a major contributor to poor air quality resulting in immediate and negative health impacts. Prolonged exposure to black carbon is associated with a 6.8 percent increased risk of cardiovascular disease. And ambient particulate matter in the air less than 2.5 microns (PM2.5), of which black carbon is a disproportionately hazardous component, is linked to an estimated 4.7 million premature deaths globally each year.78
Black carbon’s climate effect is variable, depending on emission altitude, co-emitted pollutants, and interactions with clouds and snow or ice surfaces.79 It has an atmospheric lifetime of only days to weeks,80 the shortest of any major climate pollutant, which means emissions reductions today produce a measurable atmospheric response within days rather than decades. However, the effects can be difficult to measure against a baseline given variability in conditions. See Appendix A for an explanation of black carbon and GWP metrics.
A concentrated set of sources produce anthropogenic black carbon emissions. Residential solid fuel combustion, practiced by nearly one-third of the global population for heating and cooking, contributes nearly half of anthropogenic black carbon emissions81 and is also the leading cause of household air pollution, responsible for an estimated 3.7 million premature deaths annually.82 Transportation is the next-largest source, accounting for roughly one-quarter of anthropogenic emissions, generated primarily by diesel combustion in road vehicles and maritime shipping.83 When black carbon is directly deposited at high latitudes, it accelerates regional ice melt with consequences for security and Arctic ecosystems. Industrial sources, especially brick kilns and coke ovens in China and South Asia, are also significant; these industries together account for nearly 79 percent of China’s total black carbon output.84 Unvented kerosene lamps and gas flaring at oil and gas facilities are smaller but locally significant sources.
Effective black carbon interventions require a nuanced, source-specific approach. Black carbon is frequently co-emitted with organic carbon (with the ratio varying by source) which tends to reflect sunlight and cool the atmosphere rather than warm it. Climate mitigation strategies should therefore be focused on sources with the highest black-to-organic-carbon ratio.

Despite its variable effect on climate, under the 2°C scenario, the IPCC assumes black carbon emissions are reduced by more than half by 2050. Global modeling suggests that this is feasible, and specifically that fully implementing available control measures over a 20-year period could cut global black carbon emissions by as much as 80 percent, with a substantial share achievable at net cost savings.85
Promising mitigation measures include transforming vehicles and shipping from diesel to electric and using ultra-low sulfur fuels.86 Prioritizing retrofits on Arctic and near-Arctic shipping routes may offer a disproportionate climate return because of deposits of soot settling directly onto snow and ice, reducing reflectivity (albedo effect) and causing greater localized warming impact.87
In the residential sector, clean cookstove programs can deliver net cost savings of approximately $6 per ton of CO2e even before accounting for health benefits and directly reducing the household air pollution burden.88 Sources with the largest health burden, regardless of their net warming effect, remain the clearest public health priority.
These five superpollutants collectively have a defining strategic property: they are responsible for a disproportionate share of near-term warming and the technology to abate them is available now, in many cases at low or negative net cost. That combination—outsized near-term climate impact paired with mature, deployable solutions—is precisely what makes superpollutants a distinct opportunity for corporate climate strategy. This potential is separate from, and complementary to, carbon dioxide reductions. The scientific and technical case established in this chapter is, on its own, not yet a strategic one. It defines superpollutants and why their physics matter; it does not yet articulate whether companies are seizing that opportunity, why they should, or how.
The following chapters take up each of those questions in turn.
Endnotes
Numbering follows the report, so the web and print editions cite alike.
- “Super Pollutants” Climate & Clean Air Coalition, 22 July 2024. www.ccacoalition.org/news/super-pollutants. ↩
- Sophie Szopa et al., “Short-Lived Climate Forcers. In Climate Change 2021: The Physical Science Basis. Contribution of Working Group I to the Sixth Assessment Report of the Intergovernmental Panel on Climate Change” (Cambridge University Press, 2021), 817–922, https://www.ipcc.ch/report/ar6/wg1/chapter/chapter-6/ https://doi.org/10.1017/9781009157896.008 ↩
- https://www.nature.com/articles/s41467-026-68586-y and https://www.pnas.org/doi/10.1073/pnas.2123536119 ↩
- https://www.nature.com/articles/s41612-025-01131-8 ↩
- Shine, K., Fuglestvedt, J. S., Hailemariam, K., & Stuber, N. (2005). Alternatives to the Global Warming Potential for Comparing Climate Impacts of Emissions of Greenhouse Gases. Climatic Change, 68(3), 281-302. https://doi.org/10.1007/s10584-005-1146-9 ↩
- IPCC, V. Masson-Delmotte, P. Zhai, et al., “Summary for Policymakers,” in Climate Change 2021: The Physical Science Basis. Contribution of Working Group I to the Sixth Assessment Report of the Intergovernmental Panel on Climate Change (2021), https://doi.org/10.1017/9781009157896.001. ↩
- Chris Smith et al, “Table 7.SM.6: Greenhouse gas lifetimes, radiative efficiencies and metrics,” in Climate Change 2021: The Physical Science Basis. Contribution of Working Group I to the Sixth Assessment Report of the Intergovernmental Panel on Climate Change (2021), https://www.ipcc.ch/report/ar6/wg1/downloads/report/IPCC_AR6_WGI_Chapter07_SM.pdf. ↩
- ”Accelerating Action on Tropospheric Ozone: A Strategic Roadmap for 2025-2030,“ Clean Air Fund, June 26, 2025, https://www.cleanairfund.org/resource/accelerating-action-on-tropospheric-ozone/. ↩
- J. Jason West et al., “Global health benefits of mitigating ozone pollution with methane emission controls,” Proceedings of the National Academy of Sciences 103, no. 11 (March 14, 2006): 3988–3993, https://doi.org/10.1073/pnas.0600201103https://pubmed.ncbi.nlm.nih.gov/16537473/. ↩
- United Nations Environment Programme and Climate and Clean Air Coalition (2021). “Global Methane Assessment: Benefits and Costs of Mitigating Methane Emissions.” Nairobi: United Nations Environment Programme. ↩
- Ibid. ↩
- Ibid. ↩
- Ibid. ↩
- “Methane Emissions,” Overview of Greenhouse Gases, United States Environmental Protection Agency, last modified March 10, 2026, https://www.epa.gov/ghgemissions/methane-emissions. ↩
- Z. Zhang, et al, ”Emerging role of wetland methane emissions in driving 21st century climate change,” Proc. Natl. Acad. Sci. U.S.A. 114 (36) 9647-9652 (2017), https://doi.org/10.1073/pnas.1618765114. ↩
- Qing Zhu et al, “Advancements and opportunities to improve bottom-up estimates of global wetland methane emissions,“ Environ. Res. Lett. (20) 023001, (2025) DOI:10.1088/1748-9326/adad02. “Methane,” Earth Indicators, National Aeronautics and Space Administration,, accessed June 15, 2026, https://science.nasa.gov/earth/explore/earth-indicators/methane/. National Academies of Sciences, Engineering, and Medicine 2024 A Research Agenda Toward Atmospheric Methane Removal (Washington, D.C.: National Academies Press) Online: https://nap.nationalacademies.org/catalog/27157 ↩
- Center for Climate and Energy Solutions (C2ES), ”Accelerating the Substantial Reduction of Methane Emissions by 2030 ,”(2025), https://www.c2es.org/document/accelerating-the-substantial-reduction-of-methane-emissions-by-2030/. Thomas Stoerk et al., “Global Methane Action Pays for Itself at Least Six Times Over,” Science 390, no. 6772 (October 2025), https://doi.org/10.1126/science.adu7392. ↩
- ”Methane abatement options,” Methane Tracker 2020, IEA, 2020, https://www.iea.org/reports/methane-tracker-2020/methane-abatement-options ↩
- “Oil and Gas Methane Mitigation Program,” Methane, Clean Air Task Force, accessed August 11, 2026, https://www.catf.us/methane/mitigation-program/. “Global Methane Tracker 2025: Methane Abatement Costs in the Energy Sector,” Reports, International Energy Agency, May 7, 2025, https://www.iea.org/reports/global-methane-tracker-2025. ↩
- Aklilu W. Alemu et al., “3-Nitrooxypropanol Decreased Enteric Methane Production From Growing Beef Cattle in a Commercial Feedlot: Implications for Sustainable Beef Cattle Production,” Frontiers in Animal Science 2 (February 16, 2021): 641590, https://doi.org/10.3389/fanim.2021.641590. ↩
- “Waste Sector Solutions,” Short-Lived Climate Pollutants, Climate and Clean Air Coalition, accessed August 11, 2026, https://www.ccacoalition.org/content/waste-sector-solutions. Patrick S. Sullivan, The Importance of Landfill Gas Capture and Utilization in the U.S., Earth Engineering Center, Columbia University and SCS Engineers, April 2010, https://www.scsengineers.com/wp-content/uploads/2015/03/Sullivan_Importance_of_LFG_Capture_and_Utilization_in_the_US.pdf. ↩
- United Nations Environment Programme and Food and Agriculture Organization of the United Nations, ”Global Nitrous Oxide Assessment,“ (Nairobi: UNEP, November 2024), https://wedocs.unep.org/items/fe972a7d-7aa2-4337-b27d-0cd857046eb9. ↩
- Chris Smith et al, “Table 7.SM.7: Greenhouse gas lifetimes, radiative efficiencies, global warming potentials (GWPs), global temperature potentials (GTPs) and cumulative global temperature potentials (CGTPs),” in Climate Change 2021: The Physical Science Basis. Contribution of Working Group I to the Sixth Assessment Report of the Intergovernmental Panel on Climate Change (2021), https://www.ipcc.ch/report/ar6/wg1/downloads/report/IPCC_AR6_WGI_Chapter07_SM.pdf. ↩
- United Nations Environment Programme and Food and Agriculture Organization of the United Nations, ”Global Nitrous Oxide Assessment,” Nairobi: UNEP and FAO, 2024, https://doi.org/10.59117/20.500.11822/46562. A. R. Ravishankara, Josh. S. Daniel, and Robert W. Portmann, ”Nitrous Oxide (N2O): The Dominant Ozone-Depleting Substance Emitted in the 21st Century,”. Science 326,123-125(2009). DOI:10.1126/science.1176985 ↩
- William F. Lamb et al., “Emissions Trends and Drivers,” in Climate Change 2022: Mitigation of Climate Change. Contribution of Working Group III to the Sixth Assessment Report of the Intergovernmental Panel on Climate Change, Cambridge: Cambridge University Press, (2022), doi: 10.1017/9781009157926.004 https://www.ipcc.ch/report/ar6/wg3/chapter/chapter-2/ ↩
- Tian H., et al., ”Global nitrous oxide budget (1980-2020),” Earth Syst. Sci. Data, 16, 2543–2604, (2024). https://doi.org/10.5194/essd-16-2543-2024 ↩
- Ibid. ↩
- “Nitrous Oxide Emissions,” Overview of Greenhouse Gases, United States Environmental Protection Agency, March 2, 2026, https://www.epa.gov/ghgemissions/nitrous-oxide-emissions. ↩
- Andrew J. Thomson et al., “Biological Sources and Sinks of Nitrous Oxide and Strategies to Mitigate Emissions,” Philosophical Transactions of the Royal Society B: Biological Sciences 367, no. 1593 (May 5, 2012): 1157–68, https://doi.org/10.1098/rstb.2011.0415. ↩
- US EPA, “Global Mitigation of Non-CO2 Greenhouse Gases: Nitric and Adipic Acid Production.” https://19january2017snapshot.epa.gov/global-mitigation-non-CO2-greenhouse-gases/global-mitigation-non-CO2-greenhouse-gases-nitric-and_.html ↩
- D. Ferland, et al., “Improved Nitrogen Fertilizer Management Reduces Nitrous Oxide Emissions in a Northern Prairie Cropland,” Science of The Total Environment 956 (December 15, 2024), https://doi.org/10.1016/j.scitotenv.2024.177211. ↩
- Gu, B., et al., ”Cost-effective mitigation of nitrogen pollution from global croplands,” Nature 613, 77–84 (2023). https://doi.org/10.1038/s41586-022-05481-8. “Improve Nutrient Management,” Cut Emissions, Project Drawdown. last updated December 23, 2025, https://drawdown.org/explorer/improve-nutrient-management ↩
- Singh U, et al., ”Technological avenues and market mechanisms to accelerate methane and nitrous oxide emissions reductions,” iScience, (November 24, 2022), 24;25(12):105661. doi: 10.1016/j.isci.2022.105661. ↩
- “Fluorinated Gas Emissions,” Greenhouse Gas Emissions, U.S. Environmental Protection Agency, March 10, 2026, https://www.epa.gov/ghgemissions/fluorinated-gas-emissions. ↩
- Molina, M. and Rowland, F, ”Stratospheric sink for chlorofluoromethanes: chlorine atom-catalyzed destruction of ozone., “Nature 249, 810–812 (1974). https://doi.org/10.1038/249810a0. World Meteorological Organization (WMO). Executive Summary. Scientific Assessment of Ozone Depletion: 2022, GAW Report No. 278, 56 pp.; WMO: Geneva, 2022. ↩
- Chris Smith et al, “Table 7.SM.7: Greenhouse gas lifetimes, radiative efficiencies, global warming potentials (GWPs), global temperature potentials (GTPs) and cumulative global temperature potentials (CGTPs),” in Climate Change 2021: The Physical Science Basis. Contribution of Working Group I to the Sixth Assessment Report of the Intergovernmental Panel on Climate Change (2021), https://www.ipcc.ch/report/ar6/wg1/downloads/report/IPCC_AR6_WGI_Chapter07_SM.pdf. “About Montreal Protocol,” Ozone Action, United Nations Environment Programme, accessed August 11, 2026 https://www.unep.org/ozonaction/who-we-are/about-montreal-protocol. ↩
- Ozone Secretariat, United Nations Environment Programme, ”Handbook for the Montreal Protocol on Substances that Deplete the Ozone Layer,” Fourteenth Edition, (2020), https://ozone.unep.org/sites/default/files/Handbooks/MP-Handbook-2020-English.pdf ↩
- “Figure 1: Global ODS Banks in kt of Substance,” in Global Banks of Ozone Depleting Substances (ODS) and Hydrofluorocarbons (HFCs): A Country-Level Estimate 2024, Climate and Ozone Protection Alliance, (2025), https://www.copalliance.org/imglib/publications/2025-04_COPA_Global%20Banks%20ODS%20HFC_update.pdf. ↩
- Chris Smith et al, “Table 7.SM.7: Greenhouse gas lifetimes, radiative efficiencies, global warming potentials (GWPs), global temperature potentials (GTPs) and cumulative global temperature potentials (CGTPs),” in Climate Change 2021: The Physical Science Basis. Contribution of Working Group I to the Sixth Assessment Report of the Intergovernmental Panel on Climate Change (2021), https://www.ipcc.ch/report/ar6/wg1/downloads/report/IPCC_AR6_WGI_Chapter07_SM.pdf. ↩
- Velders, G. J. M., et al, ”Projections of hydrofluorocarbon (HFC) emissions and the resulting global warming based on recent trends in observed abundances and current policies,” Atmos. Chem. Phys., 22, 6087–6101, (2022), https://doi.org/10.5194/acp- 22-6087-2022. ↩
- United Nations Environment Programme. “Global Cooling Watch 2023: Keeping it Chill: How to meet cooling demands while cutting emissions,” (2023). Nairobi. ↩
- “Fluorinated Gas Emissions,” Greenhouse Gas Emissions, United States Environmental Protection Agency, March 10, 2026, https://www.epa.gov/ghgemissions/fluorinated-gas-emissions. ↩
- Chris Smith et al, “Table 7.SM.7: Greenhouse gas lifetimes, radiative efficiencies, global warming potentials (GWPs), global temperature potentials (GTPs) and cumulative global temperature potentials (CGTPs),” in Climate Change 2021: The Physical Science Basis. Contribution of Working Group I to the Sixth Assessment Report of the Intergovernmental Panel on Climate Change (2021), https://www.ipcc.ch/report/ar6/wg1/downloads/report/IPCC_AR6_WGI_Chapter07_SM.pdf. ↩
- X. Wu, et al, ”State of the art on the flammability of hydrofluoroolefin (HFO) refrigerants,“ International Journal of Refrigeration, 108:209-223, (2019), https://doi.org/10.1016/j.ijrefrig.2019.08.025. ↩
- Michael Garry, ”The Rising Threat of HFOs and TFA to Health and the Environment,“ ATMOsphere, (July 2025), https://atmosphere.cool/wp-content/uploads/2025/07/2025_HFO_TFA_report.pdf. ↩
- “Time to Leapfrog over the Chemical Industry’s Next Generation of Climate-Wrecking Refrigerants,” News, Environmental Investigation Agency, July 10, 2025, https://eia-international.org/news/time-to-leapfrog-over-the-chemical-industrys-next-generation-of-climate-wrecking-refrigerants/. Cool Up Programme, ”Why Refrigerant Choice Matters: The Impact of “Forever Chemicals” on Our Environment,“ (July 2025), hosted by the United Nations Environment Programme, https://ozone.unep.org/system/files/documents/Cool%20Up_%20OEWG47_PFAS_final.pdf. ↩
- Ibid. ↩
- Jens Mühle et al., “Perfluorocarbons in the global atmosphere: tetrafluoromethane, hexafluoroethane, and octafluoropropane,” Atmospheric Chemistry and Physics 10, no. 11 (June 2010): 5145–5164, https://doi.org/10.5194/acp-10-5145-2010. ↩
- M. An, et al., ”Substantial increase in perfluorocarbons CF4 (PFC-14) and C2F6 (PFC-116) emissions in China,” Proc. Natl. Acad. Sci. U.S.A. 121 (30) e2400168121, (July 15, 2024), https://doi.org/10.1073/pnas.2400168121 (2024). ↩
- Ibid. ↩
- Shengyao Shi et al., “Recent advances in degradation of the most potent industrial greenhouse gas sulfur hexafluoride,” Chemical Engineering Journal 470 (August 15, 2023): 144166, https://doi.org/10.1016/j.cej.2023.144166. ↩
- “Sulfur Hexafluoride (SF6): The Most Potent Greenhouse Gas,” IFEAA, accessed October 22, 2024, https://www.ifeaa.com/2024/10/22/sulfur-hexafluoride-sf6-the-most-potent-greenhouse-gas/. ↩
- Simmonds, P. G., et al, ”The increasing atmospheric burden of the greenhouse gas sulfur hexafluoride (SF6),” Atmos. Chem. Phys., 20, 7271–7290, (2020), https://doi.org/10.5194/acp-20-7271-2020. An, M., et al, ”Sustained growth of sulfur hexafluoride emissions in China inferred from atmospheric observations,” Nat Commun 15, 1997 (2024). https://doi.org/10.1038/s41467-024-46084-3 ↩
- Chris Smith et al, “Table 7.SM.7: Greenhouse gas lifetimes, radiative efficiencies, global warming potentials (GWPs), global temperature potentials (GTPs) and cumulative global temperature potentials (CGTPs),” in Climate Change 2021: The Physical Science Basis. Contribution of Working Group I to the Sixth Assessment Report of the Intergovernmental Panel on Climate Change (2021), https://www.ipcc.ch/report/ar6/wg1/downloads/report/IPCC_AR6_WGI_Chapter07_SM.pdf ↩
- Stephen Russell, “Nitrogen Trifluoride Now Required in GHG Protocol Greenhouse Gas Emissions Inventories,” World Resources Institute, May 22, 2013, https://www.wri.org/insights/nitrogen-trifluoride-now-required-ghg-protocol-greenhouse-gas-emissions-inventories. ↩
- RF Weiss, J Muhle, PK Salameh, CM Harth, 2008, Nitrogen trifluoride in the global atmosphere, Geophysical Research Letters, 35, L20821, https://doi.org/10.1029/2008GL035913 ↩
- Willem Vriesendorp, Anastasia O’Rourke, Ethan Olim, Selin Gören, Sage Wen, Bending the curve: Cost-effective cooling emissions reduction pathways for commercial real estate in China and the U.S. (Carbon Containment Lab, 2026,) https://carboncontainmentlab.org/publications/bending-the-curve ↩
- Christina Theodoridi et al., Lifecycle Refrigerant Management: How minimizing leaks and maximizing reclaim can avoid up to 91 billion metric tons CO2-eq emissions (Natural Resources Defense Council; Environmental Investigation Agency; Institute for Governance & Sustainable Development, 2022), 4, https://www.nrdc.org/sites/default/files/lrm-90-billion-ton-opportunity-report-20221020.pdf ↩
- Technological and Economic Assessment Panel, TEAP Task Force Report on Lifecycle Refrigerant Management (United Nations Environmental Program, 2024), https://ozone.unep.org/system/files/documents/TEAP-May2024-DecXXXV-11-TF-Report.pdf ↩
- “Glossary: Tropospheric ozone precursors,” Statistics Explained, European Commission, accessed August 11, 2026, https://ec.europa.eu/eurostat/statistics-explained/index.php?title=Glossary:Tropospheric_ozone_precursors. ↩
- Clean Air Fund, ”Accelerating Action on Tropospheric Ozone: A Strategic Roadmap for 2025–2030,” (June 26, 2025), https://s40026.pcdn.co/wp-content/uploads/Accelerating-Action-on-Tropospheric-Ozone-Clean-Air-Fund.pdf. ↩
- Wei Song et al., “Important contributions of non-fossil fuel nitrogen oxides emissions,” Nature Communications 12 (January 2021): 243, https://doi.org/10.1038/s41467-020-20356-0. ↩
- Sophie Szopa et al., “Short-Lived Climate Forcers,” in Climate Change 2021: The Physical Science Basis. Contribution of Working Group I to the Sixth Assessment Report of the Intergovernmental Panel on Climate Change, ed. Valérie Masson- Delmotte et al. (Cambridge and New York: Cambridge University Press, 2021), chap. 6, pp. 817–922, https://www.ipcc.ch/report/ar6/wg1/downloads/report/IPCC_AR6_WGI_Chapter06.pdf . ↩
- Ibid. ↩
- Ibid. ↩
- Shiri Avnery et al., “Global Crop Yield Reductions due to Surface Ozone Exposure: 2. Year 2030 Potential Crop Production Losses and Economic Damage under Two Scenarios of O3 Pollution,” Atmospheric Environment 45, no. 13 (April 2011): 2297– 2309, https://doi.org/10.1016/j.atmosenv.2011.01.023. ↩
- Yuan Wang et al., “Substantially Underestimated Global Health Risks of Current Ozone Pollution,” Nature Communications 16 (2025): 285, https://doi.org/10.1038/s41467-024-55450-0. ↩
- Ibid. ↩
- World Economic Forum, “Black Carbon Reduction: A Rapid Action Plan,” White Paper, World Economic Forum, (October 2024), https://www3.weforum.org/docs/WEF_Black_Carbon_Reduction_2024.pdf. Xuping Song et al., “Is Short-Term and Long-Term Exposure to Black Carbon Associated with Cardiovascular and Respiratory Diseases? A Systematic Review and Meta-Analysis Based on Evidence Reliability,” BMJ Open 12, no. 5 (2022): e049516, https://doi.org/10.1136/bmjopen-2021-049516. GBD 2021 Risk Factors Collaborators, ”Global burden and strength of evidence for 88 risk factors in 204 countries and 811 subnational locations, 1990-2021: A systematic analysis for the Global Burden of Disease Study 2021,” Lancet 403, 2162–2203 (2024). ↩
- Tami C. Bond et al., “Bounding the Role of Black Carbon in the Climate System: A Scientific Assessment,” Journal of Geophysical Research: Atmospheres 118, no. 11 (2013): 5380–5552, https://doi.org/10.1002/jgrd.50171. ↩
- “Black carbon,” Short-Lived Climate Pollutants, Climate and Clean Air Coalition, https://www.ccacoalition.org/short-lived-climate-pollutants/black-carbon. ↩
- Yusuf Jameel, Paul C. West, and Dawn Jasper, “Sources, Regional Patterns, and Trends,” in Reducing Black Carbon: A Triple Win for Climate, Health, and Well-Being, Project Drawdown, 2023, https://drawdown.org/publications/reducing-black-carbon/sources-regional-patterns-and-trend. ↩
- ”A Vision for Clean Cooking Access for All,” International Energy Agency, 2023, https://www.iea.org/reports/a-vision-for-clean- cooking-access-for-all ↩
- Yusuf Jameel, Paul C. West, and Dawn Jasper, “Sources, Regional Patterns, and Trends,” in Reducing Black Carbon: A Triple Win for Climate, Health, and Well-Being, Project Drawdown, 2023, https://drawdown.org/publications/reducing-black-carbon/sources-regional-patterns-and-trend. “Black carbon,” Short-Lived Climate Pollutants, Climate and Clean Air Coalition, https://www.ccacoalition.org/short-lived-climate-pollutants/black-carbon. ↩
- Jin Li et al., “Mitigating black carbon emissions: key drivers in residential usage and coke/brick production,” National Science Review 11, no. 10 (October 2024), https://doi.org/10.1093/nsr/nwae283. ↩
- “Black Carbon.” Climate and Clean Air Coalition, accessed August 11, 2026, https://www.ccacoalition.org/short-lived-climate-pollutants/black-carbon. United Nations Environment Programme & World Meteorological Organization, ”Integrated Assessment of Black Carbon and Tropospheric Ozone,” UNEP/WMO, (2011), https://www.ccacoalition.org/sites/default/files/resources/2011_integrated-assessment-FULL_UNEP-WMO.pdf ↩
- The World Bank, ”Reducing Black Carbon Emissions from Diesel Vehicles: Impacts, Control Strategies, and Cost-Benefit Analysis,“ Climate and Clean Air Coalition / The World Bank, (2014), https://www.ccacoalition.org/sites/default/files/resources//Reducing%20Black%20Carbon%20Emissions%20from%20Diesel%20Vehicles.pdf. ↩
- James Hansen and Larissa Nazarenko, “Soot Climate Forcing via Snow and Ice Albedos,” Proceedings of the National Academy of Sciences 101, no. 1 (December 2003): 423–28, https://doi.org/10.1073/pnas.2237157100. ↩
- United Nations Environment Programme & World Meteorological Organization, ”Integrated Assessment of Black Carbon and Tropospheric Ozone,” Nairobi, Kenya: United Nations Environment Programme, (2011) https://www.ccacoalition.org/sites/default/files/resources/2011_integrated-assessment-FULL_UNEP-WMO.pdf ↩